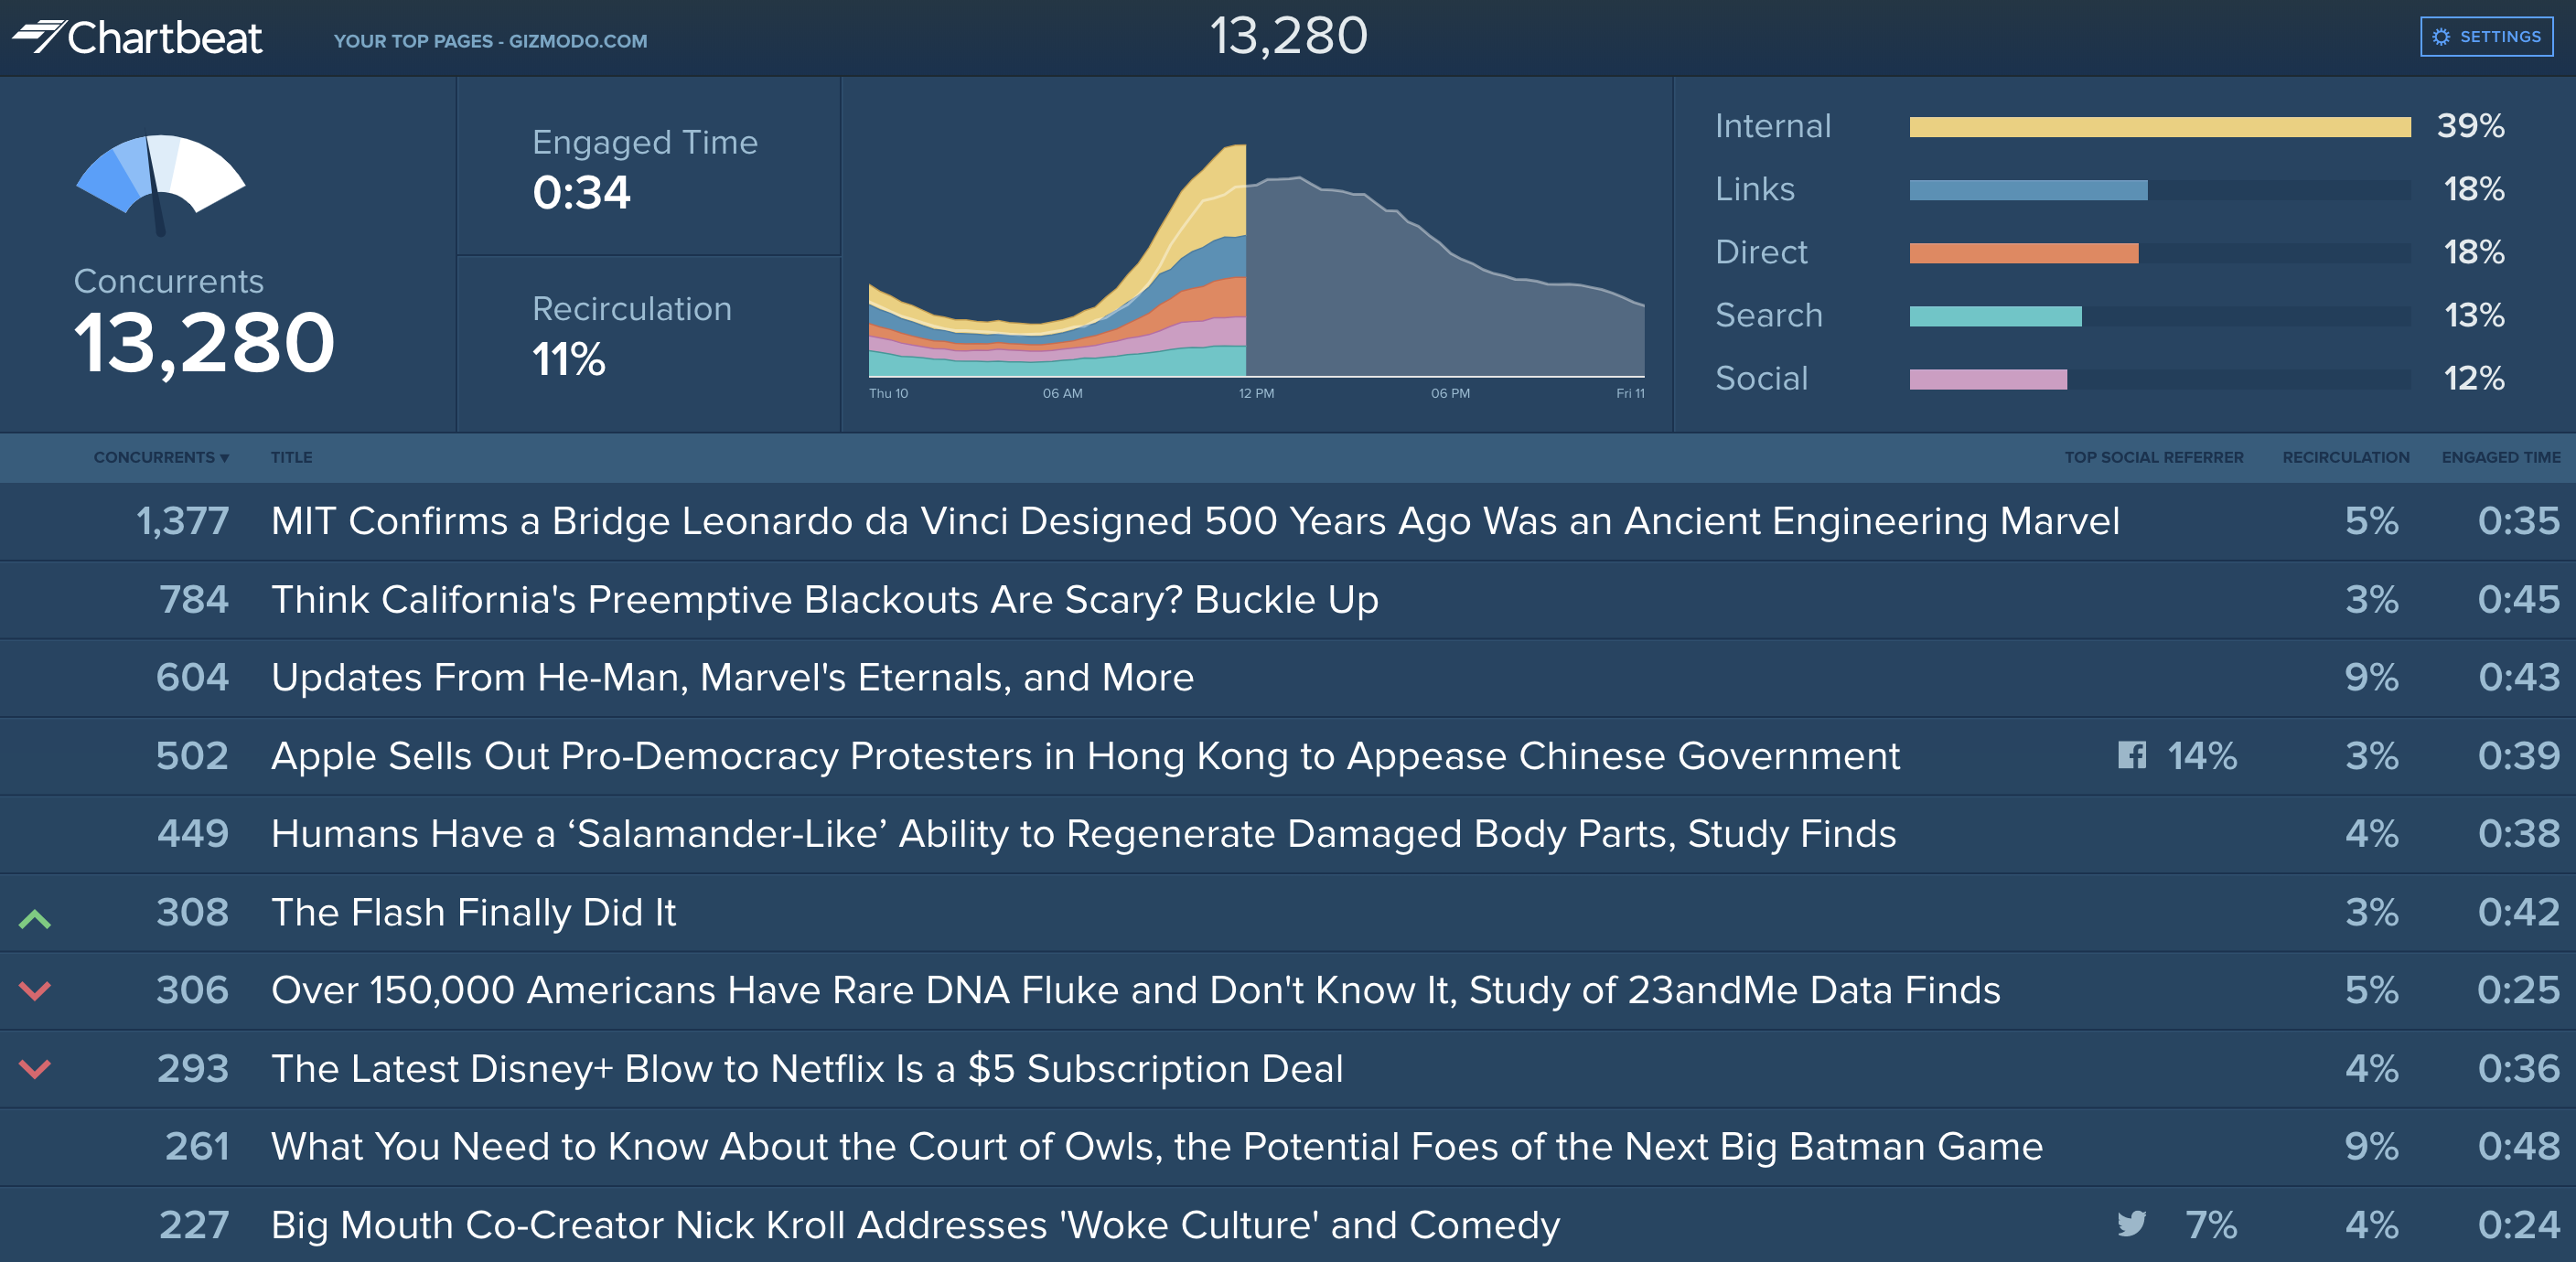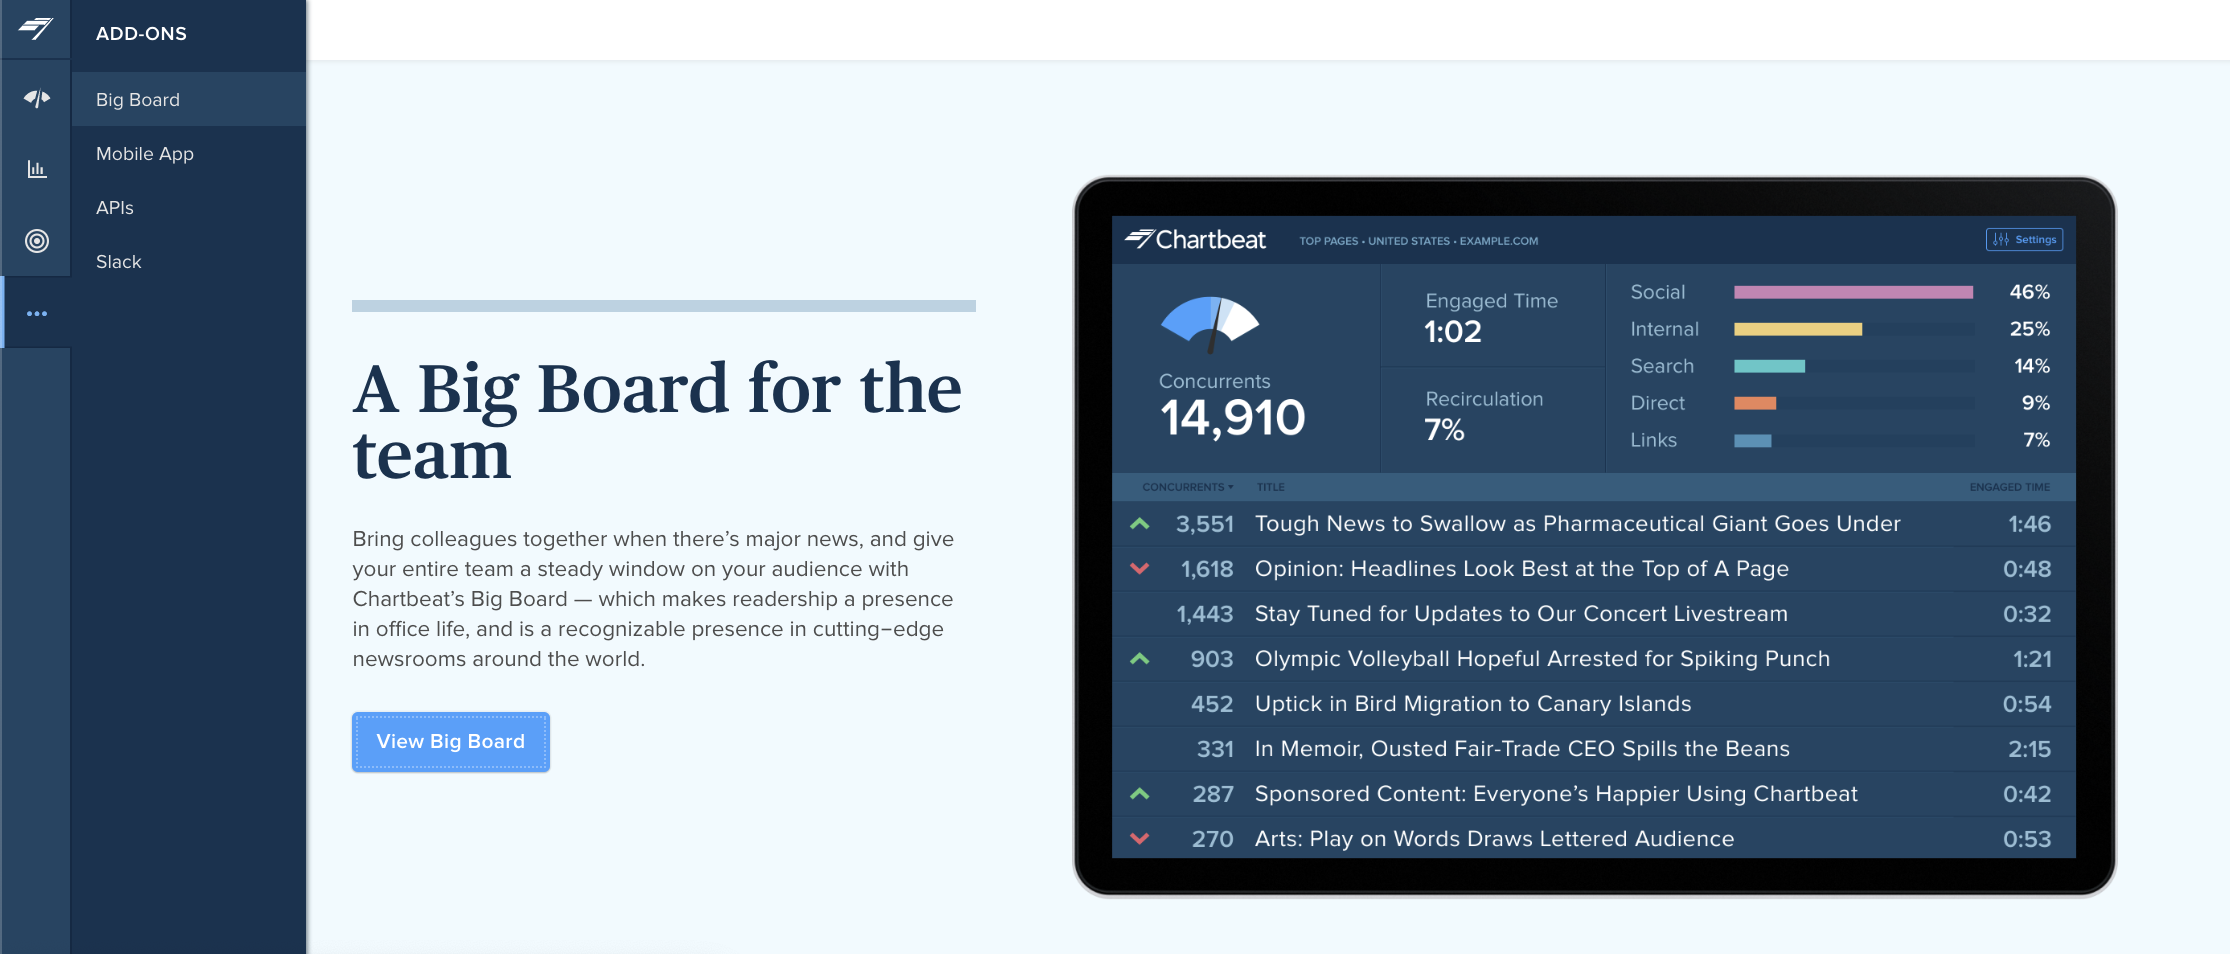
A view of your site's data designed for large-format display in the office, and a recognizable presence in cutting-edge newsrooms around the world. The Big Board unites your newsroom around your real-time audience data so everyone knows what stories & topics are succeeding at attracting large audiences and holding visitors' attention in the moment.
Main Metrics
Similar to the Real-time Dashboard, the Big Board is centered around three real-time audience metrics:
Concurrents: a live count of all active sessions open to your site currently.
Recirculation: the percentage of active users reading additional pages on your site, directly referred by one of your other article pages.
Engaged Time: the average number of seconds visitors spend reading on your site.
Installation
The simplest way to access the Big Board in your browser is from the add-ons menu in our left-hand navigation for chartbeat.com signed-in users:

There are a number of ways to display this on the big screen in your newsroom, including more basic setups like display mirroring via TV-connected devices like Apple TV or Chromecast, using your smart TV's built-in web browser, or setting up a more reliable digital signage system with the raspberry pi. However you choose to display the Big Board on your big screen, we recommend getting started with the following two steps on your desktop PC...
Step 1: Explore the Big Board's display configuration options (detailed below) to identify the preferred display(s) for your newsroom. For example, you may choose to show or hide author names under article titles, and the same goes for landing pages and recirculation percentages in the top pages list.
As you select different display options from the Big Board settings pane, URL parameters will be added automatically to the display URL in your browser so you can easily copy a URL that includes your preferred display settings into your digital signage program.
Step 2: Once you've found your preferred display settings, add one more parameter to the URL QSPs:
&apikey={insert your Chartbeat API key here}
This parameter will grant access to the device that requests the Big Board URL from our servers, skipping the chartbeat.com sign-in screen and preventing your display device from occasionally being signed out and redirected to our sign-in page as the login cookie expires.
Create a new API key with all access to any site from your account settings.
You may want to create a unique user account with admin access and use this account solely to generate the all-access API key that powers your Big Board. Since API keys are tied to individual user accounts within your organization, this can help prevent interruption of service caused by the disabling of user accounts as staff members come and go.
Want to maximize the impact of the Big Board in your office? Here's a link you can use that includes our favorite optimized display settings; hiding landing pages from the top pages list, showing author names under article titles, showing the traffic graph and total readers at the top of the dashboard, and displaying page-level recirculation rates for your top stories. Just plug in your site name and API key:
https://chartbeat.com/labs/publishing/bigboard/{INSERT SITE NAME}/?showGraphs=true&network=true&nolps=true&showAuthors=true&showRecirc=true&apikey={INSERT API KEY}
Settings
Click on the Settings button in the top-right corner of the Big Board to explore the various options available to configure your display. We've described all of these options below...
Sort by
Sort the top pages list by concurrents (default), average engaged time, or site context if you are using the Big Board to display a Multi-Site View configuration.
Filters
Domain(s): select any number of domains that you have access to and see them rolled up into a single Big Board.
Section(s): Apply a section filter to the dashboard to see metrics and top pages for a particular section.
Subscribers: If your selected domain has our subscriber engagement integration enabled in the tracking snippet, this filter appears with options to filter on only your guest registered, or subscribed users.
Platform: Filter the top pages by either desktop, tablet, or mobile and see how content is performing across various device types.
Location: Select a specific country or city you want to filter on and see how your content is reaching a regional audience.
Traffic Source: Choose from our five traffic source categories to filter on active users referred by search, social platforms, etc.
Visitor Frequency: Select new, returning, or loyal visitors to see how your content correlates with different audience groups.
Limit: Limit the number of top pages shown in the ranking; set to 15 by default but you can set it up to 50.
Toggle Settings
Show Graphs: Displays the three main Chartbeat metrics, traffic sources, as well as the concurrents graph at the top of the Big Board. Use it to get a fuller picture of your audience at a glance.
Site Total: Displays the total number of concurrents on your domain (or collection of domains), even if you’ve applied a specific filter.
Social Referrers: For articles with significant social traffic, we'll display social referrer badges with share of traffic percentages.
Landing Pages: Landing pages are included by default but can be hidden from view so you’re only looking at your top article pages.
Hide Numbers: Hides all the metric numbers from the screen, perfect if you want to share your big board outside the company but don’t want to expose your actual numbers.
Hide Recirculation: Hidden by default, you can opt to display page-level recirculation percentages on the right-hand side, next to Engaged Time.
Show Authors: Shows article authors beneath titles.