Our Heads Up Display provides page-level user scroll depth data at a glance, but you can also access this data from our Advanced Queries tool using our "Scroll Depth Histogram" group. This article explains how to create a heat map of your historical visitor scroll data for a given page on your site using Advanced Queries with Google Sheets.
Report Setup
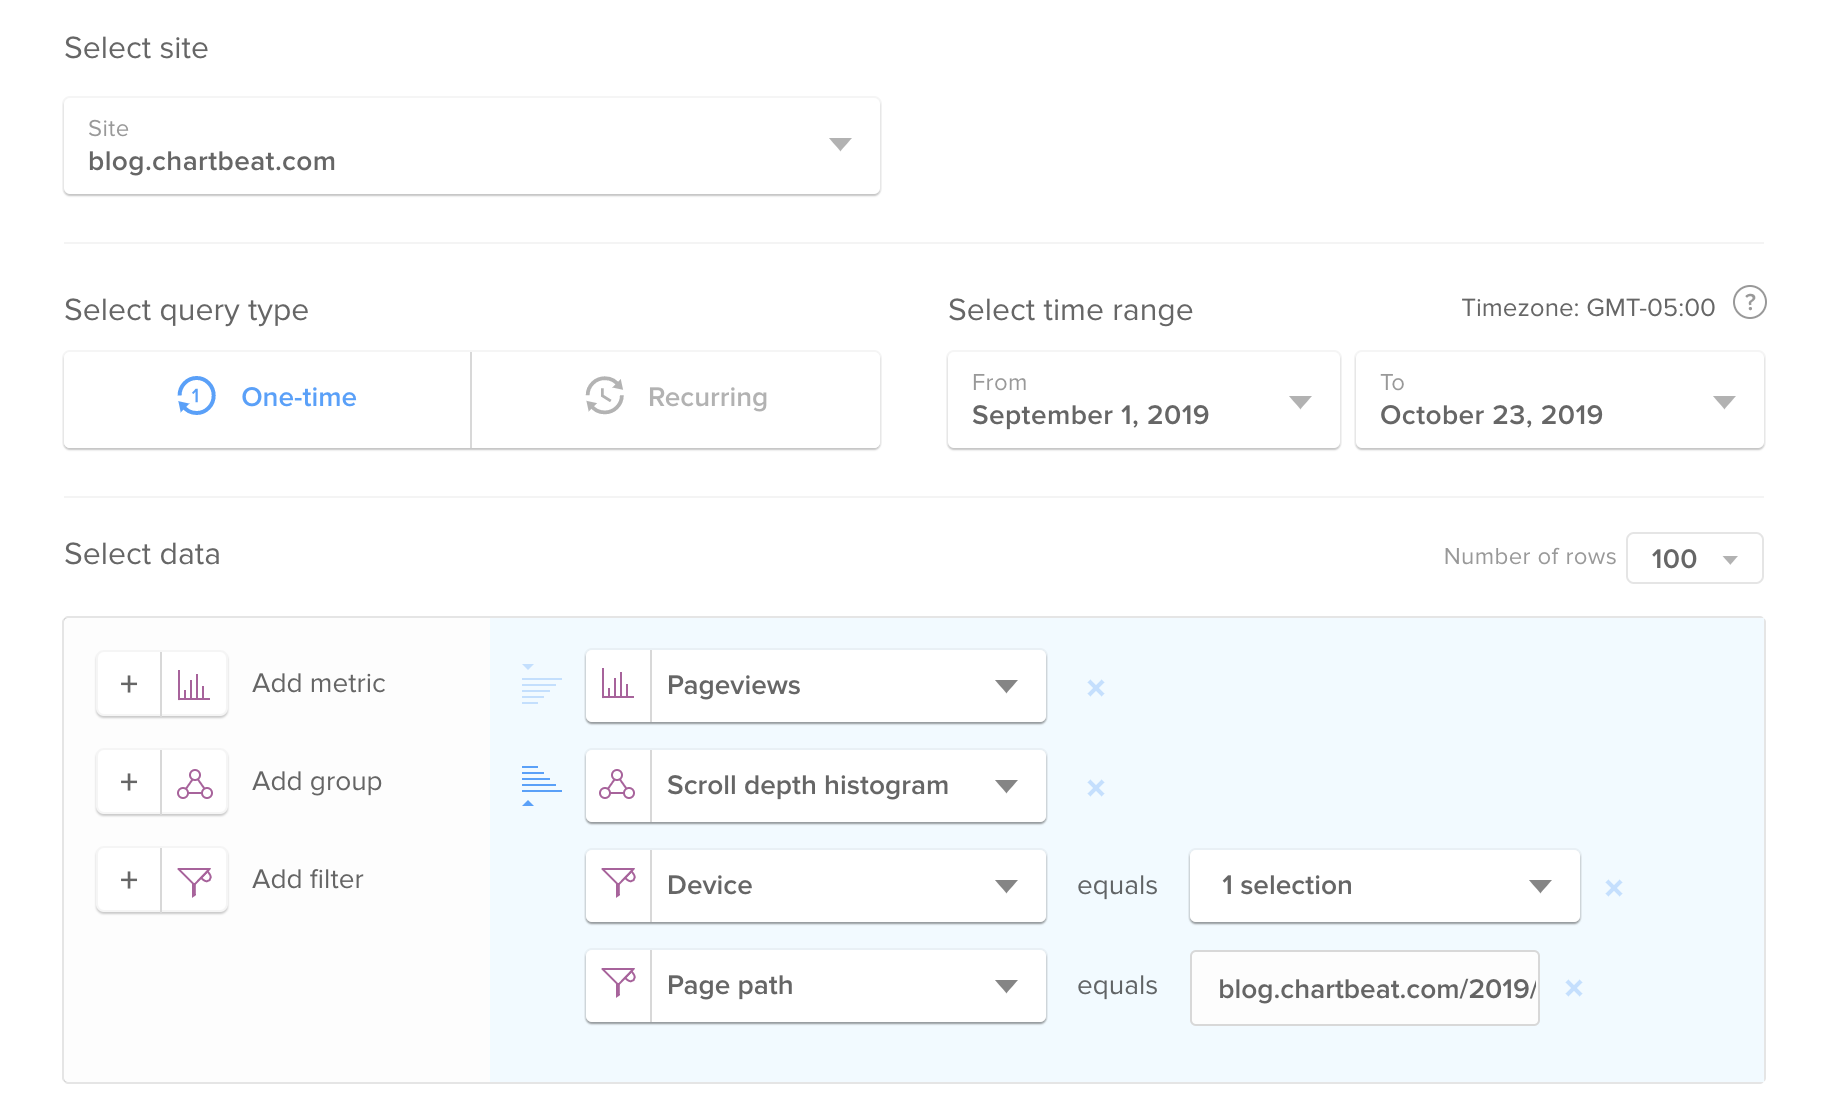
We have many pre-populated templates in our Advanced Queries tool. Click the "Use a template" button on the right side of the Advanced Queries tool to see all the options available, then select "Article scroll depth" to populate the query data with the following parameters:

Metrics
Pageviews: Will return the total number of pageviews for your selected page path and date range, grouped by 100-pixel buckets, representing the maximum distance scrolled from the top of the page for each unique pageview session
Group
Scroll depth histogram: Histogram of the number of pixels scrolled, in 100-pixel buckets
Filters
Device: Choose which device you'd like to view from mobile, desktop, and tablet. You can also use the Device group instead and return results for mobile, desktop, and tablet in one report (Tip: Bump the row limit up to 1000 or more!)
Page Path: Set this to a single page path, like your homepage
After running the query, your report should return data in the following format:
| scroll_hist | page_views |
| 0 | 35214 |
| 100 | 2114 |
| 200 | 1647 |
| 300 | 988 |
| 400 | 858 |
| 500 | 799 |
| 600 | 844 |
| 700 | 1009 |
| 800 | 1052 |
| 900 | 989 |
| 1000 | 1285 |
| 1100 | 1335 |
| 1200 | 1353 |
| 1300 | 1089 |
Create your scroll depth heat map in Google Sheets
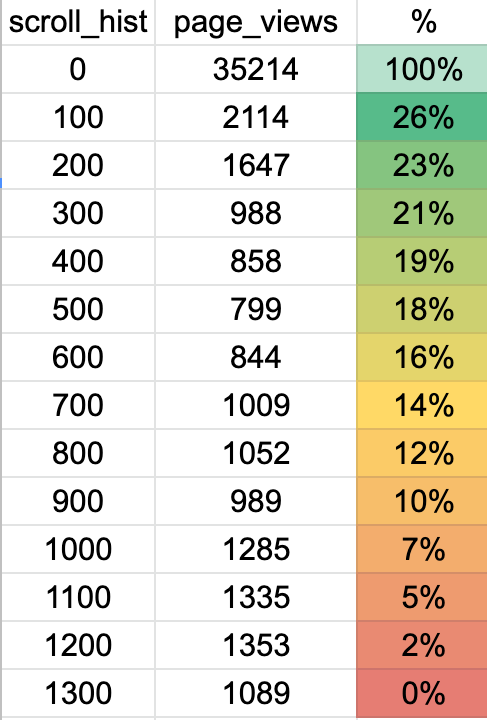
Import the CSV export into a new Google Sheets file. Add a third column using the following formula to represent your pageviews-by-scroll-depth data as the percentage of pageviews that resulted in user scroll equal to or greater than the corresponding 100-pixel scroll depth in the scroll_hist column:
(SUM OF ALL PVS minus SUM OF PVs THROUGH THE CURRENT CELL) over SUM OF ALL PVs
You will need to sum the total pageviews from the page_views column in order to create this formula in Google Sheets. To view an example of this formula in action within Google Sheets, find the link to our sample heat map report at the bottom of this article.
When this formula is correctly applied to your new column in Google Sheets to represent percentage of pageviews by distance scrolled down the page, you can add an extra visualization layer to this data with color scale conditional formatting:
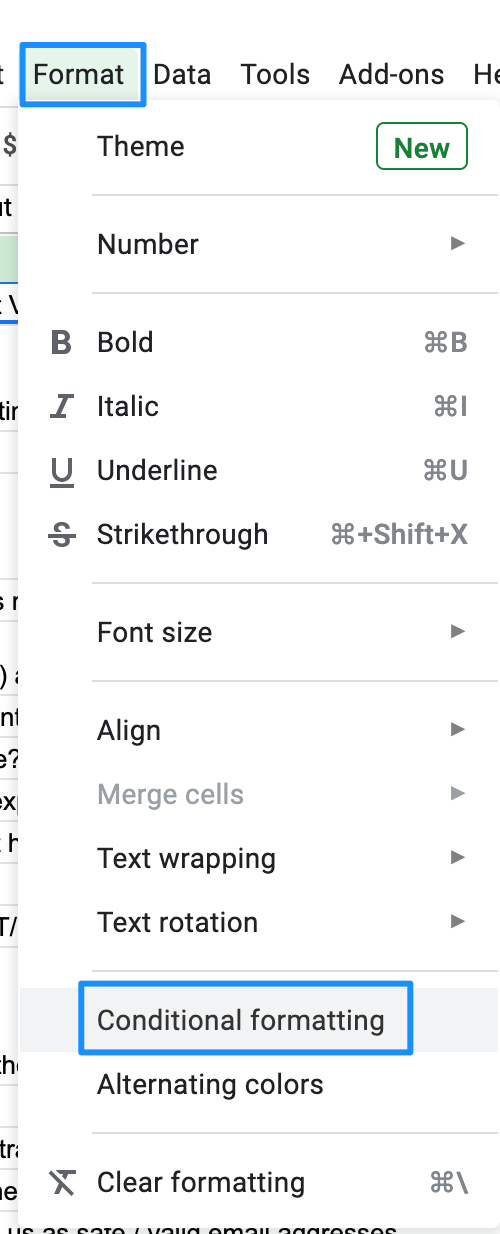
In Google Sheets, click Format > Conditional Formatting...

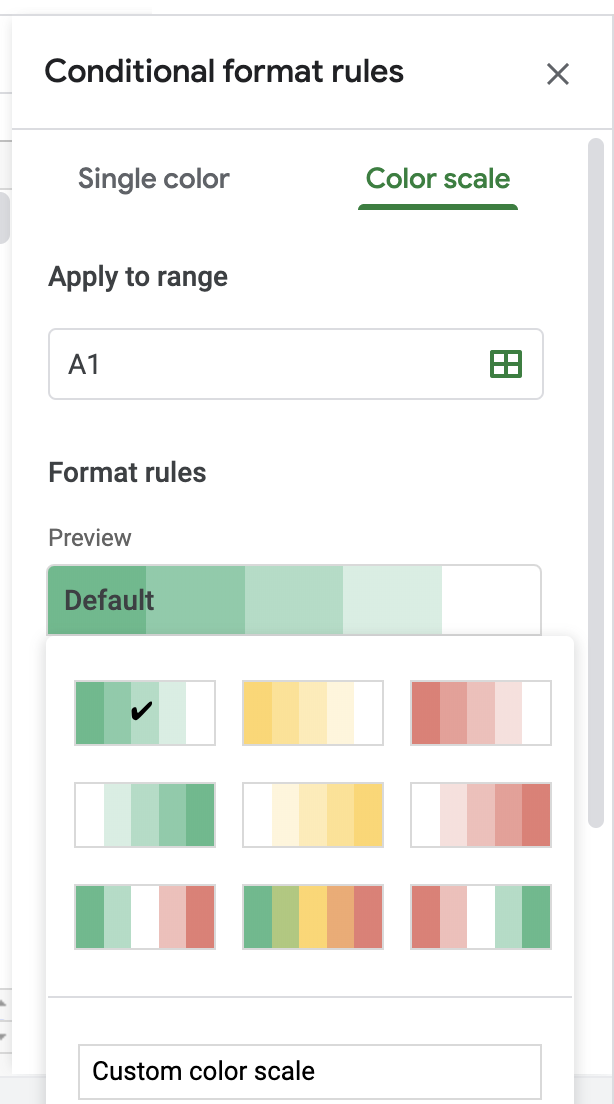
Next, apply a Color scale to your percentage range and select your desired color format...


Your scroll depth heat map is complete! To view an example completed heat map report in Google sheets, find our sample report here.